This is a question I’m frequently asked. No easy answers.
I have gone by a couple of rules of thumb, that help me to understand where a company is at in their marketing priorities. I start with looking to see if there is a “10% of Gross” budget allocated to marketing. This helps me to see if the company is aggressive in seeking new markets or passive with word of mouth marketing.
I was taught once that a market driven company should have a 40% Product, 40% Sales and Marketing and 20% Administration budget structure. In other words this CEO taught me that his philosophy was to spend as much selling the product as making it. I admit he did double the size of the company in the three year period he was the CEO, before the company was sold for a nice profit.
Most people want a formula they can follow, to take to a board to justify asking for more budget, so I found this article that made sense to me, although in the end it still comes back to the 10% budget give or take a bit!
Try at your own risk, but certainly feel free to contact me and ask for help setting a reasonable marketing budget based around your own goals.
The Marketing budget is usually set once a year and sets the tone for the demand creation and demand management plans that drive the sales pipeline for the second half of the year and the first half of the following year. In most organisations, there is never enough time for planning and analysis so seize the moment now and commit to strategic thinking to build a budget that will serve as your true north for the year ahead as you build out the go-to-market plan.
Create a Marketing Budget
In terms of creating Marketing budgets, there are two diametrically opposed approaches (here’s what you get vs. what do you need) and many variations within. In terms of the polar opposites, there is the top-down and the bottom-up approaches. In the top down approach, the CFO usually drives the process and Marketing is given a number that the financial model produces. Marketing then adjusts headcount and program spend to fit within the given number. In a bottom-up approach, direction is given to Marketing that states the organizations objectives such as:
- product revenue needs to be x$
- market share needs to be y%
- xx new customers need to be added
- the installed based revenue growth needs to be yy%
- indirect channels need to bring in zz$
Based on these objectives, Marketing then develops a plan and corresponding budget to achieve the targets. Once Marketing creates the plan and budget, it is then reviewed (CEO, CFO, VPS and VPM) and adjustments are made to the objectives, strategies, tactics and budget. This is really an if/then budgeting process that correlates expense to revenue.
Context
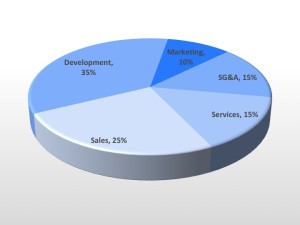 It’s a good idea to provide an overall context of how Marketing fits into the organization. One way to do this is to create a pie chart of all the employees in the organization by functional group. Then, repeat the above exercise now for expense dollars. This is a great objective and quantifiable way to establish a context of where the organization has invested over the years before determining what the next years investment should be.
Timeframe
When creating a budget, Marketing needs to be anywhere from 6-12 months ahead of the sales plan, as there is a lead time that is required from a qualified lead to becoming a closed won deal. In short, whatever the average sales cycle is (the time it takes from a qualified lead to moving to closed won status) will be the amount of time Marketing needs to be spending program dollars ahead of the sales budget.
Technically, there is another three months that needs to be added on as it takes, on average, 3 months to design, develop and execute a program to create a qualified lead. Make certain that this lead time is accounted for in the budget as it will have direct impact on the demand creation and demand management plans.
Field Marketing vs Global Programs
In larger organizations, it is necessary to split and manage program dollars between Field Marketing or Regional Marketing and Global Programs. The ratio between the two will vary but there are a couple of rules of thumb to guide investment.
First, the larger the organization, the more the program dollar split is in favour of Field or Regional Marketing. The basic concept here is that as an organization gets larger, there are more geographies, products and customers and the need for finer segmentation is greater and that drives the need for customized programs. In very small organizations the ratio may be 80:20 (Global Programs:Field Marketing) and in really large companies it could swing the other way (20:80).
Traditionally, these splits tend to fall between 60:40 to 40:60. The litmus test is whether one program can be created that that will drive qualified leads, relatively equally, for all geographies. This means that if global programs designs, develops and executes a program it can’t bias the US over EMEA or the western region of the US over the eastern region. The other point to consider is geographic spread and cultural differences. New York City, or any other major city in the world benefits from great density as opposed to the southeast in the US where a sales rep my have to drive an hour or more to reach customers or prospects.
With respect to culture, London and Germany are very personal in nature so formal face-to-face events are preferred over emails, social media, and banner. A solid demand creation and management plan will include a combination of global programs and field programs so the task is to optimize the mix.
Budget Format
In general, the budget should include as much granularity as possible since it is easier to roll numbers up, as opposed to recreating detail after the fact. For presentation purposes, columns and rows can be hidden or the master budget can drive another version of the budget that can be created for distribution.
It’s a good idea to include monthly, quarterly and yearly detail. Monthly is good for reconciling expenses with finance and managing cash flow, quarterly numbers align well with the company’s targets and yearly is suited for annual planning. Include percent change columns from quarter to quarter but measuring the percent change Q1 Year 1 from Q1 Year 2 is typically more insightful as it adjusts for seasonality.
Seasonality becomes very important in organizations that have a use it or lose it budget process each year. In this scenario, it’s critical not to take the budget and divide it by 4 to calculate quarterly numbers as you will most likely lose budget dollars because they were not allocated appropriately. If you create a bottoms-up budget, this will account for seasonality and lead time.
If that is not the case, at a minimum, use last year’s quarterly revenue numbers and divide by the fiscal year total to calculate percentages to use for each quarter. Ideally, you will phase shift the percentages by the average sales cycle. For example, if Q3 is typically 27% of revenue and the average sales cycle is 6 months, then phase shift the 27% from Q3 to Q1.
Categories
Within the Marketing budget it is key to set up meaningful categories as it aids in budget negotiations and creating relevant metrics. Headcount is a good category to start with and it’s wise to include a few sub categories such as:
- monthly base pay
- bonuses (annual, quarterly and spot)
- factor in raises from the month they will hit
- add in new hires and any planned departures
- travel and entertainment
- professional development
Always include a section for overhead. Include all the detail is it is available, if it is not, a good assumption is to add 15-20% to cover benefits, the building, charge backs, etc.
Program Spend
Discretionary or program spend needs to be thought through in detail as this is the first expense targeted by the CFO for expense cuts (travel and contractors are typically first to be reduced or eliminated and the focus is to reduce marketing programs). With this in mind, it is imperative to build the Marketing budget as a function of revenue and that requires a reverse engineering of revenue or the bookings target. The basic drill includes a little math:  Marketing then needs to reverse engineer the number of responses or leads and qualified leads required to generate the desired number of qualified opportunities.
Now, it’s time to develop a demand creation plan that includes the demand creation strategy, demand creation vehicles, timeline and budget. A complete listing of each demand creation vehicle should be listed in the budget that will drive the waterfall.
It’s important that the numbers associated with this plan are modeled out to document when they need to be designed, developed and executed and what they produce, when they produce trickled through the waterfall and what it will cost.
Details here are critical. If there is a need to decrease expenses and program dollars come under scrutiny, this detail will allow the correlation of qualified opportunities and revenue dollars reduced by program dollar cuts.
Vendor Spend
Vendor spend is another area that CFO’s like to target for expense cuts so it is a good idea to think this section through and document why each vendor is important, the value they provide and the pain it will cause to the organization (revenue) if there are decreases. Sometimes vendors are used in place of full-time employees (FTEs), for their unique expertise or for economies of scale.
It is important to develop a justification that includes the financial impact for hiring FTEs (the time lag, ramp, recruiting fees, etc.) or the additional expense of trying to learn and do it yourself. PR, social media, web development, creative, etc. are always targets the CFO like to hit so be prepared.
Infrastructure, Systems, Process
It’s a good idea to summarize infrastructure, systems and process expenses as they can be significant if they are not already in place or they are in need of updating. Here are some expenses that would fall into this category:
- Marketing automation system
- Database (buys, dedup’s, appends)
- Systems and process
- Website builds and redesigns
- Productivity tools (phone call automation, sales and marketing portal)
- SEO
- Metrics and dashboards
All of these expenses should be correlated to productivity gains that either decrease expenses (fewer people) or increase revenue (improve program ROI).
How to Create a Marketing Budget
In the end, the question of what does Marketing do needs to be addressed as all functions in the organization will have their hands out for funding during budgeting season. The Marketing argument can be based around brand building, helping to develop better products or generating revenue. The connection to revenue is always the strongest argument that can be put in front of a CEO or CFO so spend the time to build a stellar demand creation and demand management plan that is at the foundation of the Marketing budget.
NOX Marketing is not affiliated with nor receives commission from the above company for their product or services.
Links are for information sharing or interest sharing for the benefit of all.
Recent Comments